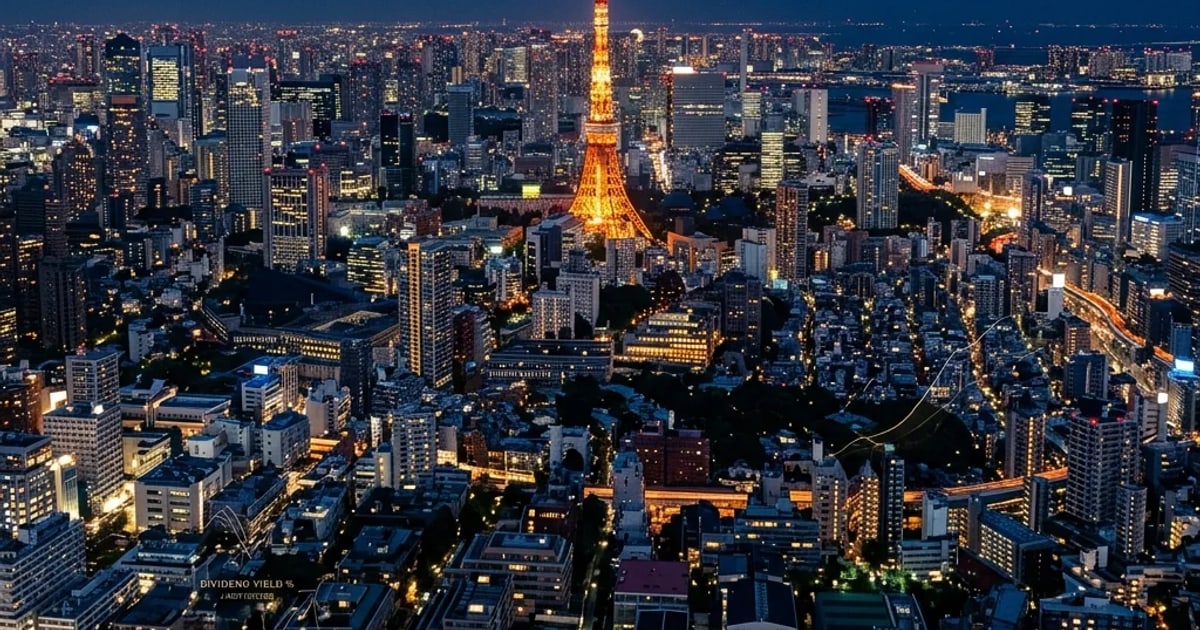
![Tokyo Core 3 Ward Home Prices — Chiyoda, Chuo & Minato [Ep.1·2026]](https://gsfark.com/assets/images/blog/tokyo-core-3-wards-chiyoda-chuo-minato-hero-og.jpg)
※ This article is for informational purposes and personal analysis only—not investment, legal, tax, or immigration advice, and not a recommendation to buy or sell any property or financial product. Verify figures, rules, and market data against official sources and consult qualified professionals; you are solely responsible for your decisions. Information reflects the time of writing and may change afterward.
Average condo prices per square meter in Tokyo’s core three wards: ¥1.947M in Chiyoda, ¥1.811M in Chuo, and ¥2.206M in Minato. “Aren’t the three core wards basically the same?” — I get that question often. My answer is always the same: no. Chiyoda, Chuo, and Minato are not interchangeable. Under the same “central Tokyo” label, they carry completely different characters, different demand profiles, and different investment logic. Let me break them down ward by ward.
This is Ep.1 of the Tokyo 23 Wards Brand Guide series. Following the Ep.0 Prologue, this first deep-dive covers the Core 3 Wards (都心3区) — Chiyoda (千代田区), Chuo (中央区), and Minato (港区).
Each ward has a distinct identity and demand base. The data tells the story clearly — but only if you look at each ward on its own terms.
Data reference period: H1 2025–2026. Ward-average prices per ㎡ are based on MLIT Real Estate Transaction Price Information; sub-area price ranges, rent ranges, and Cap Rates are editorial estimates based on market listings. Real estate prices fluctuate quarterly. Always verify with the source links provided.
Table of Contents
Open Table of Contents
1. Chiyoda
Brand Positioning
Most people think of the Imperial Palace or government offices first when they think of Chiyoda. I started with roughly that same image myself. In fact, Chiyoda is Tokyo’s most “authoritative” ward. The Imperial Palace, the National Diet, the Prime Minister’s Residence, and the Supreme Court are all located here. Marunouchi and Otemachi form the city’s financial and corporate hub — home to Japan’s mega-corporations and megabanks. To the northeast, Akihabara is a globally recognized destination for electronics and subculture.
As a residential ward, Chiyoda occupies a unique position. It has the smallest resident population of all 23 wards (approx. 67,000), yet daytime inflows of workers and visitors exceed 800,000. That scarcity of residential space keeps mansion prices at Tokyo’s highest tier.
Average Mansion Prices
| Sub-area | Price per ㎡ (2025–2026) | Per tsubo (坪) equivalent |
|---|---|---|
| Marunouchi / Otemachi vicinity | ¥1.9M–¥2.5M/㎡ | ¥6.3M–¥8.3M/坪 |
| Chiyoda / Hibiya vicinity | ¥1.6M–¥2.1M/㎡ | ¥5.3M–¥7.0M/坪 |
| Akihabara / Kanda vicinity | ¥1.1M–¥1.5M/㎡ | ¥3.65M–¥5.0M/坪 |
| Ward average | ¥1.947M/㎡ | approx. ¥6.43M/坪 |
New supply in Chiyoda is extremely limited. New units sell out within months of listing. Secondary market properties are absorbed just as quickly.
Average Rental Rates
| Type | Monthly rent range | Primary areas |
|---|---|---|
| 1R (studio) | ¥120K–180K/mo | Akihabara / Kanda |
| 1K / 1DK | ¥150K–250K/mo | Ward-wide |
| 1LDK | ¥250K–450K/mo | Hibiya / Bancho |
| 2LDK | ¥450K–900K/mo | Bancho / Ichigaya |
| 3LDK+ | ¥800K+/mo | Premium tower units |
The Bancho (番町) district is one of Tokyo’s most storied upscale residential areas, favored by diplomats and senior executives.
Average Household Income
Chiyoda’s average declared income per taxpayer is estimated at approximately ¥9.5 million — roughly double the Tokyo 23-ward average of ¥4.5M–5.0M (editorial estimate based on MIC municipal taxable-income statistics).4 Given that this is based on resident population, the actual income level of those who work here during the day is significantly higher.
Population
| Metric | Figure |
|---|---|
| Total population | approx. 67,000 (lowest of 23 wards)5 |
| Population density | approx. 4,100/km² (among the lowest) |
| Daytime population | 800,000+ |
| Trend | Gradual population growth driven by new residential development |
Foreign Resident Ratio
Chiyoda’s foreign resident ratio is approximately 4.5%. The community consists largely of foreign embassy staff, multinational company assignees, and international organization employees. Korean residents tend to be corporate assignees rather than community-based, unlike the concentration seen in Shinjuku.
Who Should Consider Chiyoda
- Relocators: Professionals whose offices are in Marunouchi or Otemachi and want minimal commute. Bancho and Hibiya are the top picks if budget allows.
- Investors: Outstanding for long-term asset value — scarcity and brand power are unmatched. Cap Rate — the ratio of annual net rental income to purchase price — runs 2–3%, which is low, but capital preservation is the strongest of the three wards.
- Visitors: The Imperial Palace Outer Garden, Hibiya Park, and Akihabara are all walkable. Ideal for combined business and tourism stays.
Landmark Spots
- Imperial Palace Outer Garden (皇居外苑) — A large green belt in the city center. Famous jogging course. Interior visits available by advance reservation.
- Marunouchi Naka-dori — 800m tree-lined boulevard with seasonal outdoor exhibitions.
- Akihabara Electric Town — The world’s leading electronics and anime/subculture district. First stop for appliance shopping after moving to Tokyo.
- KITTE — Renovated former Tokyo Central Post Office. Free rooftop garden with panoramic views of Tokyo Station.
2. Chuo
Brand Positioning
Chuo is “the oldest heart of Tokyo.” It carries three distinct faces: Nihonbashi (日本橋), the commercial center since the Edo period; Ginza (銀座), which has held Japan’s highest land prices for over 20 consecutive years; and the Tsukiji–Toyosu corridor, currently riding a redevelopment wave.
Chuo has a larger resident population than Chiyoda (approx. 191,000) and richer daily-life infrastructure. High-end residential and commercial functions coexist, making it one of the most popular wards among foreign assignees.
Average Mansion Prices
| Sub-area | Price per ㎡ (2025–2026) | Per tsubo (坪) equivalent |
|---|---|---|
| Ginza / Tsukiji | ¥1.5M–2.2M/㎡ | ¥5.0M–7.3M/坪 |
| Nihonbashi / Kyobashi | ¥1.2M–1.8M/㎡ | ¥4.0M–6.0M/坪 |
| Hamacho / Tsukishima | ¥900K–1.3M/㎡ | ¥3.0M–4.3M/坪 |
| Ward average | ¥1.811M/㎡ | ¥5.98M/坪 |
Nihonbashi’s ongoing redevelopment — anchored by COREDO Muromachi and other mixed-use projects — continues to lift the ward’s brand and drive price appreciation.
Related post: COREDO Nihonbashi and Mitsui Redevelopment Analysis
Average Rental Rates
| Type | Monthly rent range |
|---|---|
| 1R | ¥100K–160K/mo |
| 1K / 1DK | ¥130K–220K/mo |
| 1LDK | ¥220K–380K/mo |
| 2LDK | ¥350K–700K/mo |
| 3LDK+ | ¥600K+/mo |
High-floor tower units near Ginza and Tsukiji regularly exceed ¥1M/month.
Average Household Income
Chuo’s average declared income per taxpayer is estimated at approximately ¥7.3 million — well above the Tokyo average (editorial estimate based on MIC municipal taxable-income statistics).4 The resident base skews toward Ginza and Nihonbashi commercial workers, and finance/trade sector assignees.
Population
| Metric | Figure |
|---|---|
| Total population | approx. 191,000 |
| Population density | approx. 17,000/km² |
| Trend | Population has more than doubled since 2000 — one of the fastest-growing wards in Tokyo, driven by tower mansion supply |
Foreign Resident Ratio
Chuo’s foreign resident ratio is approximately 5.5% — the highest among the Core 3 on a relative basis. The community includes East Asian residents (Chinese, Korean) alongside Western finance and trade assignees.
Who Should Consider Chuo
- Relocators: Singles and couples who want both daily convenience and central access. Hamacho and Tsukishima offer the most accessible rental prices within the Core 3.
- Investors: Tower mansion Cap Rates are relatively better among the Core 3 (3–4% annually). Nihonbashi redevelopment upside makes mid-to-long-term holding attractive.
- Visitors: Ginza shopping, Tsukiji Outer Market, and Hamarikyu Gardens — Tokyo’s core tourist highlights within walking distance.
Landmark Spots
- Ginza (銀座) — Japan’s highest-priced shopping district. Flagship luxury boutiques and a pedestrian paradise on weekends.
- Tsukiji Outer Market — Morning seafood market. Your closest fresh-ingredient market once you’ve settled in.
- Hamarikyu Onshi Garden — Edo-period shogun villa turned public garden. ¥300 entry; stunning skyline backdrop.
- Nihonbashi — The origin point of all Japan’s national highways. A historical landmark in the middle of a redevelopment zone.
3. Minato
Brand Positioning
Minato is the most “international” of the Core 3. Roppongi (六本木), Azabu (麻布), Akasaka (赤坂), Shiroganedai (白金台), Shibaura (芝浦) — names that conjure images of Seoul’s Itaewon, Gangnam, and Seongsu-dong all rolled into one ward.
Minato hosts numerous foreign embassies and consulates. It has the highest foreign resident ratio of any ward in Tokyo. Roppongi Hills, Tokyo Midtown, and Azabudai Hills — Tokyo’s defining mixed-use landmarks — are all concentrated here.
I remember walking through Hiroo’s shopping street for the first time and noticing that signs were posted in English, Korean, and Chinese side by side. That’s when it clicked: this is genuinely a ward built for non-Japanese residents. If I had to name one ward in Tokyo where you can settle without a language barrier, Minato is it — no contest.
Average Mansion Prices
| Sub-area | Price per ㎡ (2025–2026) | Per tsubo (坪) equivalent |
|---|---|---|
| Azabu / Hiroo | ¥1.8M–2.8M/㎡ | ¥6.0M–9.3M/坪 |
| Roppongi / Akasaka | ¥1.5M–2.3M/㎡ | ¥5.0M–7.6M/坪 |
| Shiroganedai | ¥1.4M–2.1M/㎡ | ¥4.65M–7.0M/坪 |
| Shibaura / Tamachi | ¥1.0M–1.5M/㎡ | ¥3.3M–5.0M/坪 |
| Ward average | ¥2.206M/㎡ | ¥7.29M/坪 |
Since the opening of Azabudai Hills (2023), prices in the surrounding luxury segment have risen further. Foreign buyers are particularly concentrated in Azabu and Hiroo.
Related post: Tokyo Central 5-Ward Mansion Price Comparison
Average Rental Rates
| Type | Monthly rent range |
|---|---|
| 1R | ¥130K–200K/mo |
| 1K / 1DK | ¥160K–280K/mo |
| 1LDK | ¥280K–550K/mo |
| 2LDK | ¥500K–1.2M/mo |
| 3LDK+ | ¥1M+/mo |
3LDK+ units in Azabu and Hiroo are frequently contracted by foreign companies as executive housing. Rents above ¥2M/month are not uncommon.
Average Household Income
Minato’s average declared income per taxpayer is estimated to exceed ¥12 million — placing it at the very top of the 23 wards (editorial estimate based on MIC municipal taxable-income statistics).4 High-earning finance professionals, foreign corporate executives, and diplomatic staff make up a significant portion of the residential base.
Population
| Metric | Figure |
|---|---|
| Total population | approx. 266,000 |
| Population density | approx. 13,500/km² |
| Trend | Steady population growth driven by major redevelopment landmarks |
Foreign Resident Ratio
Minato’s foreign resident ratio is approximately 11–12% — the highest in all 23 wards.5 English and Chinese are widely usable for daily life. Foreigner-specialized real estate agencies are plentiful. The Korean community is centered around Akasaka and Roppongi.
Who Should Consider Minato
- Relocators: The clear first choice for foreign residents who need an English-friendly environment. Access to international schools, foreign-staffed clinics, and international supermarkets is unmatched.
- Investors: Abundant foreign tenant demand minimizes vacancy risk. Cap Rate is 2.5–3.5% annually — modest, but asset scarcity and FX hedging appeal make long-term holding the preferred strategy.
- Visitors: Mori Art Museum at Roppongi Hills, the National Art Center, and Tokyo Tower are all within walking distance.
Landmark Spots
- Mori Art Museum (Roppongi Hills) — Tokyo’s contemporary art landmark. Combined with the 53F Tokyo City View observatory.
- Azabudai Hills — Opened 2023. Mori JP Tower tops out at 330m — Tokyo’s tallest.
- Hiroo Shopping Street — The first stop for relocating foreigners: multiple international supermarkets in one stretch.
- Tokyo Tower — Located in Shiba Koen, Minato. Classic nighttime vantage point.
4. Side-by-Side Comparison Matrix
I get it — the numbers make Minato look like the obvious winner. But that’s not my read. If scarcity matters more to you than Cap Rate, Chiyoda is the stronger play. If you want redevelopment momentum, Chuo may offer better upside. Choosing Minato simply because it’s the most expensive is not a strategy.
| Metric | Chiyoda (千代田) | Chuo (中央) | Minato (港) |
|---|---|---|---|
| Ward area | 11.66 km² | 10.21 km² | 20.37 km² |
| Population | ~67,000 | ~191,000 | ~266,000 |
| Foreign resident ratio | ~4.5% | ~5.5% | ~11% |
| Avg. mansion price/㎡ | ¥1.947M | ¥1.811M | ¥2.206M |
| Avg. taxpayer income (est. from public statistics) | ~¥9.5M | ~¥7.3M | ~¥12M+ |
| Cap Rate (reference) | 2–3% | 3–4% | 2.5–3.5% |
| Core image | Authority / Admin / Finance | Commerce / Culture / Redevelopment | International / Luxury / Embassies |
| Foreigner livability | ★★★☆ | ★★★★ | ★★★★★ |
Putting the three wards side by side, one thing kept standing out: price is comparable, but purpose isn’t — not on the same scale. In the end, the question isn’t which ward is “better.” It’s what you weigh first.
5. Notes for Foreign Buyers
Legal Restrictions
Japan places no legal restrictions on foreign ownership of real estate. However, laws related to land acquisition (such as the Important Land Survey Act) should be confirmed with a specialist before purchase.
Mortgages
- Non-residents: Borrowing from Japanese banks is effectively unavailable. Cash purchases or collateral against home-country assets are the practical routes.
- Residents (with valid visa status): Some major banks offer mortgage products for foreign nationals, but terms vary by bank and branch — confirm directly with each lender. Typically required documents: residence card, two years of withholding tax certificates, employment contract.
Management Fees and Repair Reserve Fund
Premium tower mansions in the Core 3 can carry combined management fees and repair reserve fund — the monthly mandatory contribution set aside for long-term building maintenance — of ¥50,000–150,000/month. Always verify this separately from the purchase price.
Language and Administration
- Chuo and Minato ward offices maintain multilingual counters (English, Chinese).
- Chiyoda ward office can handle English inquiries, though some procedures remain Japanese-only.
- For real estate contracts, using a certified bilingual interpreter or a foreigner-specialist agency is strongly recommended.
View All in This Series
- Series Prologue: Where to Live in Tokyo
- Ep.2: Core 6 Wards — Shinjuku, Shibuya, Bunkyo
- Ep.3: Western Premium Residential Belt — Meguro & Setagaya
- Ep.4: Business Gateway — Shinagawa & Ota
- Ep.5: Hipster Inner Ring — Toshima, Nakano, Suginami

![Shinjuku, Shibuya & Bunkyo Home Prices and Living Profiles [Ep.2·2026]](https://gsfark.com/assets/images/blog/tokyo-shinjuku-shibuya-bunkyo-hero-og.jpg)
![Where Are Setagaya's Affluent Areas? — Seijo & Meguro Property Prices [Ep.3·2026]](https://gsfark.com/assets/images/blog/tokyo-meguro-setagaya-hero-og.jpg)