※ This article is for informational purposes and personal analysis only—not investment, legal, tax, or immigration advice, and not a recommendation to buy or sell any property or financial product. Verify figures, rules, and market data against official sources and consult qualified professionals; you are solely responsible for your decisions. Information reflects the time of writing and may change afterward.
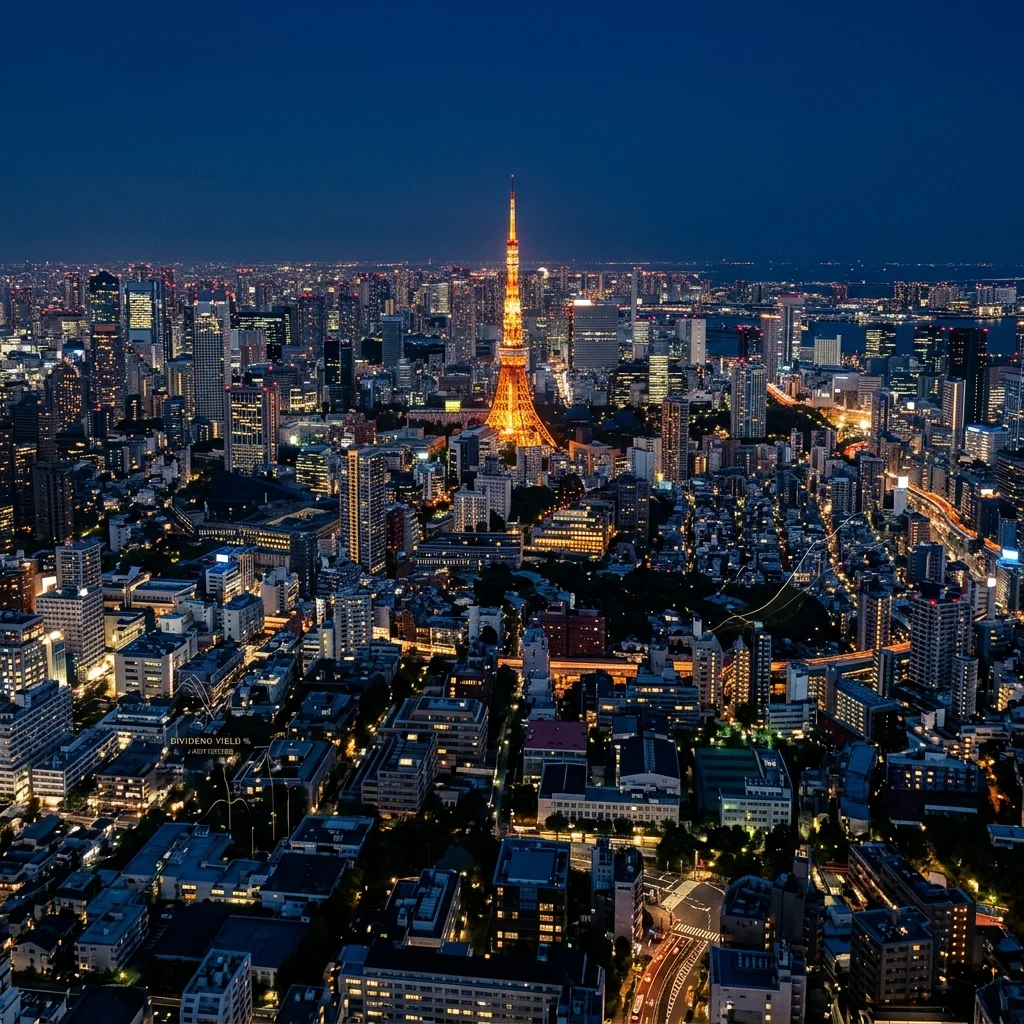
The Tokyo central office market has pushed through the “Massive Supply” concerns of 2023 and is currently navigating its hottest phase in 2026. Rents, vacancy rates, and new landmark completions are converging into a new pattern of ‘Super-Polarization’ unlike anything seen in previous cycles.
Concluding that the market is universally booming simply because vacancy is low would be a mistake. The reality revealed by the data is a cold differentiation: “Some offices are so full you can’t get in, while others remain empty even with deep rent cuts.” Today, we analyze the narrative of Tokyo’s 5 central wards based on Miki Shoji’s Q1 2026 data.
1. Return to the 2% Range: Interpreting Lagging Signals
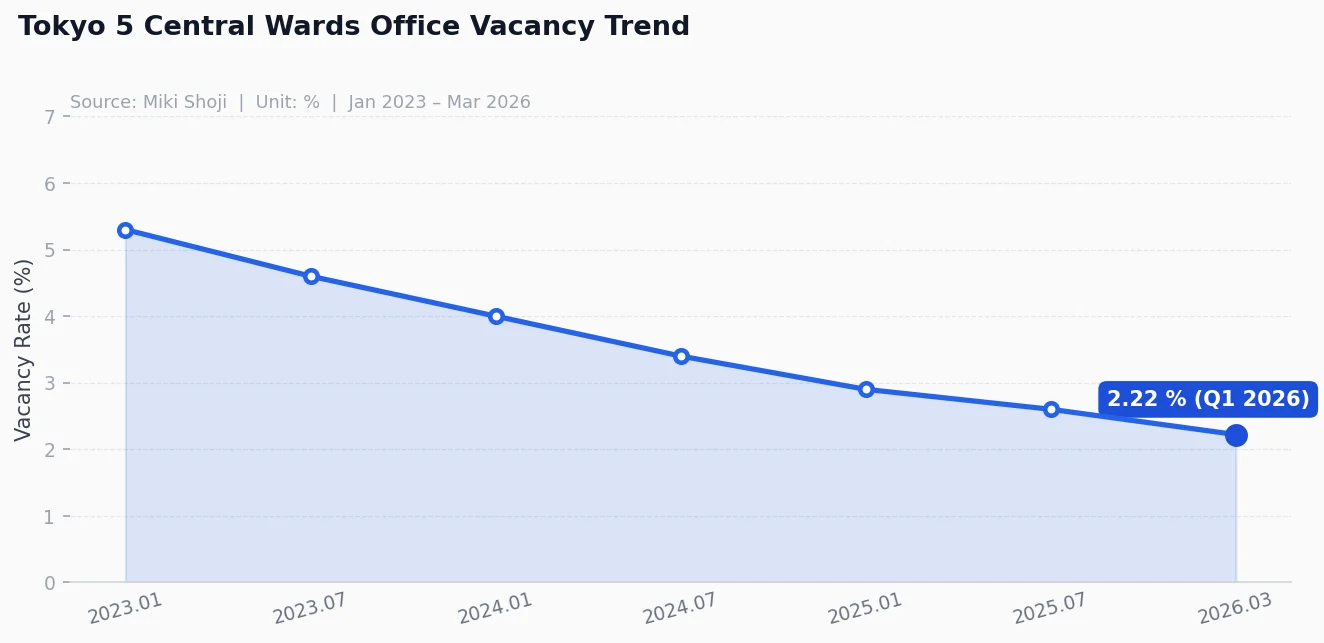
As of Q1 2026, the average vacancy rate in Tokyo’s 5 central wards (Chiyoda, Chuo, Minato, Shinjuku, and Shibuya) has dropped to 2.22%1. This is near pre-pandemic levels and follows a consistent downward trend observed throughout 2025.1
However, I view this number as a “warning” rather than a “celebration.” Vacancy is the most lagging indicator in the market. The demand for expansion and the robust absorption of high-spec new buildings moved first; the numbers are only now proving it. Particularly noteworthy is the rise in ‘Effective Rents.’ As rent-free periods shrink3, landlord bargaining power is at its highest post-pandemic peak.
2. Comparing the 5 Wards: Different Engines for Different Markets
The central 5 wards are not a monolithic market. Each ward is driven by unique demand profiles and supply pipelines.
1. Chiyoda Ward: The Power of the Institutional Moat Home to government ministries and traditional corporate headquarters, Chiyoda shows the lowest volatility. Grade A offices in Marunouchi and Otemachi are virtually fully occupied, supported by institutional demand and limited new supply. This area remains the strongest for downside protection.
2. Shibuya Ward: The Heart of IT and Creative Industries Shibuya frequently records the lowest vacancy rate among the five. Major redevelopments like ‘Shibuya Sakura Stage’ were immediately absorbed by IT firms upon completion. Companies seeking to attract young talent prioritize ‘Live-Work proximity’ and ‘Trendy environments,’ leading to the highest rent premiums.
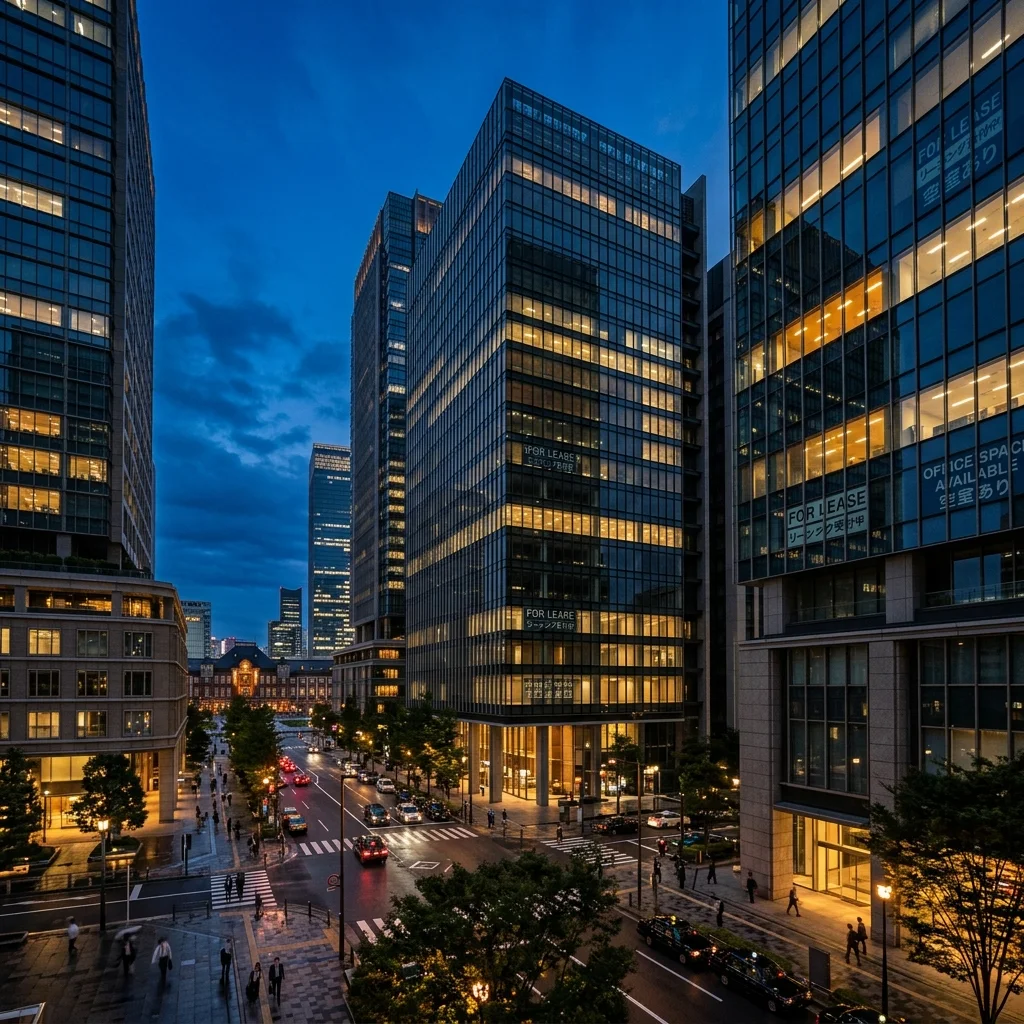
3. Minato Ward: The Test Bed for Massive Supply This area has seen the most overwhelming supply in recent years, including Toranomon-Azabudai Hills. While supply-overhang concerns were high in 2023, these landmark buildings have successfully completed their lease-ups in 2026. However, “secondary vacancy” in older Grade B buildings—vacated by tenants moving to new builds—remains a persistent issue in Minato.
4. Chuo & Shinjuku Wards: Realigning Practical Demand Chuo, the financial hub, and Shinjuku, the transportation node, see steady demand from companies seeking practical rent levels. Shinjuku, in particular, is preparing for large-scale changes over the next 5-10 years as aging buildings in the western district face reconstruction pressure.
3. Critical Pivots for Investors in 2026
What are the common traps when looking at Tokyo office data today?
- Deepening ‘Flight to Quality’: Tenants are moving not to the cheapest space, but to high-function buildings that can attract talent. While average vacancy is low, the vacancy period for older, smaller buildings is lengthening. Do not be fooled by the “average.”
- Supply Pipeline Gap4: After the massive supply spikes of 2023 and 2025, new completions will relatively taper off starting from the latter half of 2026. This will further strengthen the bargaining power of existing Grade A landlords.
- Hybrid Work Maturity: While vacancy is low, the floor area used per company is being optimized. The quality of “human-centric” design and “collaboration spaces” has become a more critical factor in determining rent than total square footage.
4. Execution Memo: How to Read the Data
I recommend the following routine for monitoring the Tokyo office market:
- Check Miki Shoji Tokyo monthly data1 (archive · portal): benchmark for vacancy and rent across the 5 wards.
- Cross-verify with REINS Market Watch2 (archive): transaction-market heat.
- Review IR Materials from Major Developers: Map out the supply pipeline for the next 5 years using data from Mitsui, Mitsubishi, and Mori.
In conclusion, Tokyo office in 2026 is a period of ‘Qualitative Restructuring’ rather than just ‘Numerical Recovery.’ If you are adjusting your asset allocation, prioritize “Hardware that attracts talent” over simply relying on the prestige of the “5 Wards” name.
Data freshness (April 2026): BOJ policy rate 0.75 %, 10-year JGB ≈ 2.43 %, TSE REIT Index ≈ 1,916, Tokyo 5-ward vacancy 2.22 % (Miki Shoji Q1 2026), Q1 2026 inbound tourists 10.68 M (JNTO). Verify the latest from linked sources before acting.
Investor Action: Session Summary & Check
- Supply/Demand: Check Miki Shoji data to see if the vacancy rate in your target ward is below 2%.
- Polarization: Visit the site to assess ‘secondary vacancy’ risks in Grade B buildings near new landmarks.
- Net Income: Don’t be fooled by nominal rent; calculate the actual yield after accounting for rent-free periods.
Recommended Series
- Tokyo Mansion Price Comparison: Chiyoda, Chuo, Minato
- Small Rental Yield vs Capital Gain Breakeven Analysis
- Japan Rate Hike Cycle: 3 Lessons for J-REIT Investing

![Tokyo's 6 Key Wards: Real Estate Data & Investment Insights [2026]](https://gsfark.com/assets/images/blog/tokyo-6-wards-real-estate-insight-hero.webp)
![Tokyo 23 Wards Complete Guide: Where to Live & Invest [2026]](https://gsfark.com/assets/images/blog/tokyo-ward-guide-series-prologue-hero.webp)