
※ This article is for informational purposes and personal analysis only—not investment, legal, tax, or immigration advice, and not a recommendation to buy or sell any property or financial product. Verify figures, rules, and market data against official sources and consult qualified professionals; you are solely responsible for your decisions. Information reflects the time of writing and may change afterward.
A high distribution yield isn’t always a good sign. With J-REITs, checking why it’s high often comes first.
J-REITs are exchange-listed real estate investment trusts that provide exposure to income and price movements from assets such as offices, logistics facilities, and housing without requiring direct property ownership. Their distributions are not fixed: interest rates, foreign exchange, asset prices, and borrowing terms all matter. Before investing, check the market structure, distributions, buying route, rate risk, and each vehicle’s portfolio.
A distribution is a visible number — what moves that number is not.
1. What is a J-REIT?
Japan’s Real Estate Investment Trusts are similar to those in the US, with several Japanese companies participating in the management market. Because listings, mergers, and delistings change the count, use the current JPX listed-issues page rather than a stale total.1
In 2000, the Japanese government amended the “Investment Trust Act” into the “Act on Investment Trusts and Investment Corporations,” allowing the funds raised by investment trusts to be used for real estate investments. This established the legal status of real estate investment trusts in Japan.
The major REITs listed on the Tokyo Stock Exchange include:
- Nippon Building Fund (NBF) REIT Inc.
- Japan Real Estate Investment Trust (JRE)
- Nippon Prologis REIT Inc.
- Nomura Real Estate Master Fund REIT
These REITs encompass various sectors including office buildings, retail, logistics, and residential real estate. The performance of these REITs can be tracked on portals such as JAPAN-REIT.COM and J-REIT.jp.
2. What are the advantages and limits of J-REITs?
Investing in Japanese Real Estate Investment Trusts (REITs) presents several benefits:
- Market Accessibility: REITs allow investors to access a diverse portfolio of real estate assets that might be difficult to achieve through direct property ownership.
- Liquidity: Unlike physical real estate, REITs can be traded during exchange hours. Trading volume and market conditions can still prevent execution at the price you want.
- Alternative to Property Ownership: REITs offer a way to invest in real estate without the burden of managing the property or paying direct property taxes.
- Distributions: Distribution yields in JPX monthly data vary over time.2 Rental income, borrowing costs, and gains or losses on asset sales can all affect distributions.
- Low Minimum Capital Requirement: Investing in REITs requires relatively low capital input, making them accessible to a broad spectrum of investors.
The Bank of Japan bought J-REITs under its earlier monetary-easing framework, but it discontinued new purchases in March 2024.6 Investors should therefore not treat continued BOJ buying as a standing support. Check how policy rates and government-bond yields affect borrowing costs and relative valuations.
A characteristic advantage of J-REITs is the system allowing “negative goodwill” to be excluded from distributable profits. For instance, if REIT ‘A’ acquires REIT ‘B’ cheaply—say REIT B is worth 60 billion KRW but is acquired for 50 billion KRW—negative goodwill of 10 billion KRW is generated. While REITs are generally required to distribute their earnings as dividends, that amount can be retained without being paid out. These resources can then be utilized during crisis situations when paying dividends becomes difficult. Ultimately, this equates to providing considerable stability to REITs.
3. How can you buy J-REITs?
One method is investing in individual REITs. Since REITs are traded on the stock market, just like trading US stocks, investing in J-REITs means investing directly in the Japanese market. The currency used is obviously the Japanese Yen since it is the Japanese market. For stability, one should consider the market’s representative individual REITs as investment targets. If you are not familiar with overseas stock investments, choosing a public mutual fund is another viable option.
Individual J-REITs trade in yen, so currency gains and losses sit alongside distributions and price movements. The examples below are constituents commonly checked when reviewing the TSE REIT Index; they do not each track the index. The image comes from http://www.japan-reit.com. Use the four-digit ticker to verify JPX data and each investment corporation’s disclosures before trading.
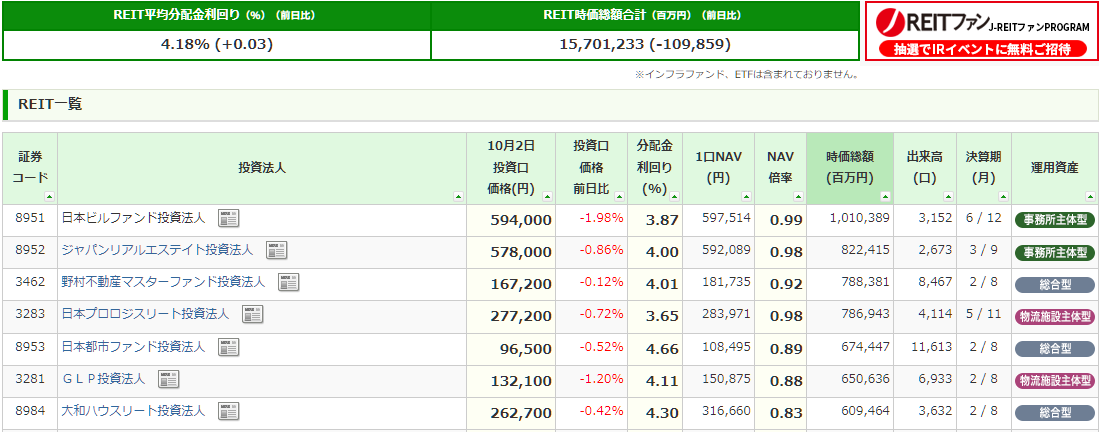
Source: reference screenshot adapted from japan-reit.com.
Editorial note: screenshots in this post are archival references and may not match current UI or latest figures. For current numbers, use the linked official pages first.
4. What drives J-REIT returns?
Distribution yields have compressed at times, but that alone is not proof that underlying property values are rising. REIT prices, rental income, borrowing costs, and gains or losses on asset sales can all move the yield.
Currently in 2026, the BOJ has raised the policy rate to 0.75 percent and the 10-year JGB yield has risen to approximately 2.43 percent—compressing the yield spread between J-REITs and government bonds to roughly 200–250 basis points. Risk sentiment around Japanese assets remains constructive on the real-estate fundamental side (vacancy at multi-year lows, record inbound tourism), but the financing environment is the tightest it has been since before the ZIRP era. Rather than assuming a one-way cycle, I treat this as a scenario exercise where cash-flow resilience and refinancing quality matter as much as momentum.
4.1 A simple scenario worksheet (illustrative)
| Case | Distribution yield | FX move (JPY vs KRW) | Price move | Back-of-envelope total |
|---|---|---|---|---|
| Defensive | 3.2% | -3.0% | -2.0% | about -1.8% |
| Base | 3.6% | 0.0% | +2.0% | about +5.6% |
| Upside | 3.8% | +4.0% | +6.0% | about +13.8% |
This is not a forecast. It is a transparency template so readers can challenge each assumption before they allocate capital.
4.2 My own scenario chart (illustrative SVG)

Method note: each bar is the arithmetic sum of the scenario inputs shown above. This chart is an educational worksheet, not a performance promise.
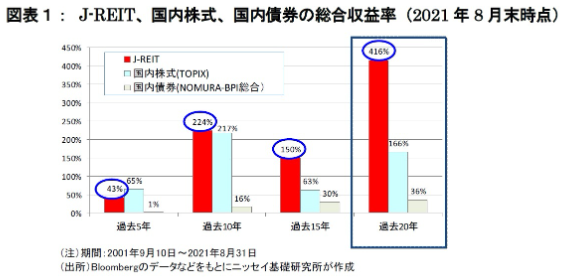
According to research conducted by the Nissei Basic Research Institute (NLI Research), as of late August 2021, the J-REIT cumulative return over the prior 20 years was 416% (annualized at approximately 8.6%)3. During the same period, TOPIX rose by only 166%—a data point that illustrates the long-run income compounding power of J-REITs.
Important context (2022–2025): The 2021 figures reflect a period of near-zero interest rates and BOJ REIT purchases. Since then, BOJ rate normalization has materially changed the environment. In 2023–2024, J-REITs significantly underperformed TOPIX; the H1 2024 total return (dividends included) was approximately −2.4% amid rate-hike anxiety. As of April 2026, the TSE REIT Index stands at roughly 1,916 points4, and the spread over the 10-year JGB (~2.43%)5 has compressed to ~200–250 bps—below the historical average of 250–300 bps. For current index data, refer to JPX J-REIT Index.
Going back through the data, this was the assumption I revised the most. The same asset class produced very different outcomes once the rate environment shifted — something that didn’t fully register until I laid the numbers side by side.
Over the 5 years ending August 2021, the return was 43%—lower than TOPIX over that shorter horizon but supported by consistent dividend distributions. The key takeaway is that long-run J-REIT performance has historically been driven by income compounding rather than capital appreciation alone—a structural advantage that remains, but must now be weighed against a tighter financing environment.
When reviewing J-REITs, compare the latest distribution yield with yen exposure, price volatility, and the borrowing structure. Historical returns and distributions do not determine future performance. Easier trading than direct property ownership comes with daily market-price risk.
Source: reference chart adapted from public quote data on investing.com.
5. What should you check in a J-REIT?
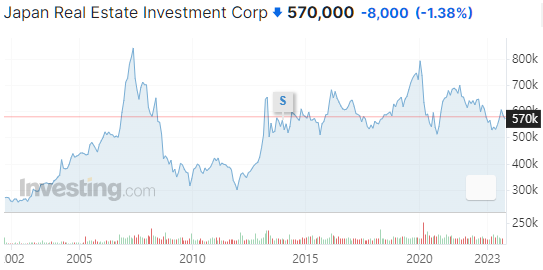
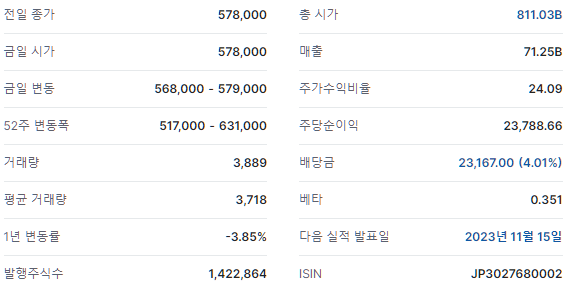
As of the end of September 2023, the total market capitalization of all J-REITs surpassed 15.7 trillion Yen. Even factoring in the weak Yen, it equates to a scale of roughly 140 trillion KRW. Looking at the top 3 REITs by market capitalization, we have the following. You can look up detailed information using the ticker symbols in the parentheses. I’ve compiled simple charts and general info from investing.com below. Please refer to them.
- Nippon Building Fund Inc (8951): Historically one of the largest J-REIT names by market value.
- Japan Real Estate Investment Corp (8952): A core office-heavy vehicle often used as a market bellwether.
- Nomura Real Estate Master Fund Inc (3462): A diversified platform with recurring institutional attention.
- Japan Metropolitan Fund Investment Corp (8953): The current name of the former Japan Retail Fund after its 2021 merger.
Data freshness note
Several numeric examples in this article are historical snapshots (mainly 2023 references) preserved for context. As of April 2026, the BOJ policy rate stands at 0.75 %, the 10-year JGB yield is approximately 2.43 %, and the TSE REIT Index is at roughly 1,916 points. Before making any decision, verify the latest monthly disclosures on J-REIT.jp and Japan REIT, then cross-check policy context with BOJ statistics.
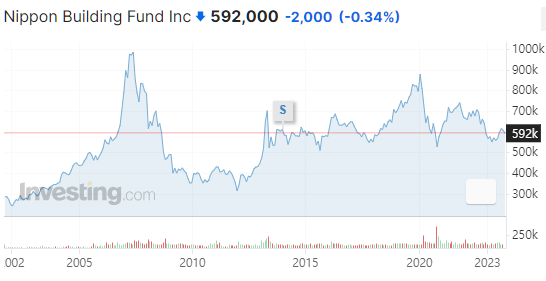
Source: investing.com ticker 8951 (reference screenshot).
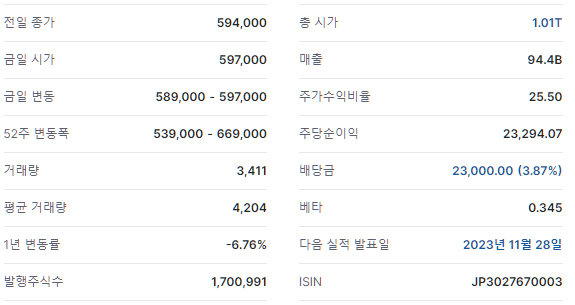
Source: investing.com ticker 8952 (reference screenshot).
Source: investing.com ticker 8953 (reference screenshot).
Source: investing.com ticker 3462 (reference screenshot).
Conclusion
J-REITs offer exposure to multiple properties with less capital than direct ownership, but not every REIT holds only central Tokyo commercial buildings. Office, residential, logistics, and hotel exposure — and borrowing terms — differ by vehicle. Rather than a market view, check each REIT’s asset mix, vacancy, debt maturity, and disclosed distribution outlook first.
What matters in the end isn’t how high the yield is, but how long it can hold.
Further reading in this series
- 3 Things to Know About Real Estate Investment in Japan
- Hotel REITs vs Office REITs: Which Recovered More After COVID?
- Japan Rate-Hike Cycles and J-REITs: Three Historical Lessons
Investor Action: Session Summary & Check
- NAV: Check whether the current price is at a discount or premium to Net Asset Value.
- LTV: Audit individual REIT financial statements to ensure LTV is stable at the 40-50% level.
- Sectors: Review the weight of logistics or hotel sectors that can pass on inflation through rent increases.


![Tokyo's 23 Wards Compared — Property Prices & Living Environments [2026]](https://gsfark.com/assets/images/blog/tokyo-ward-guide-series-prologue-hero-og.jpg)
![Tokyo's 6 Key Wards: Real Estate Data & Investment Insights [2026]](https://gsfark.com/assets/images/blog/tokyo-6-wards-real-estate-insight-hero-og.jpg)