※ This article is for informational purposes and personal analysis only—not investment, legal, tax, or immigration advice, and not a recommendation to buy or sell any property or financial product. Verify figures, rules, and market data against official sources and consult qualified professionals; you are solely responsible for your decisions. Information reflects the time of writing and may change afterward.
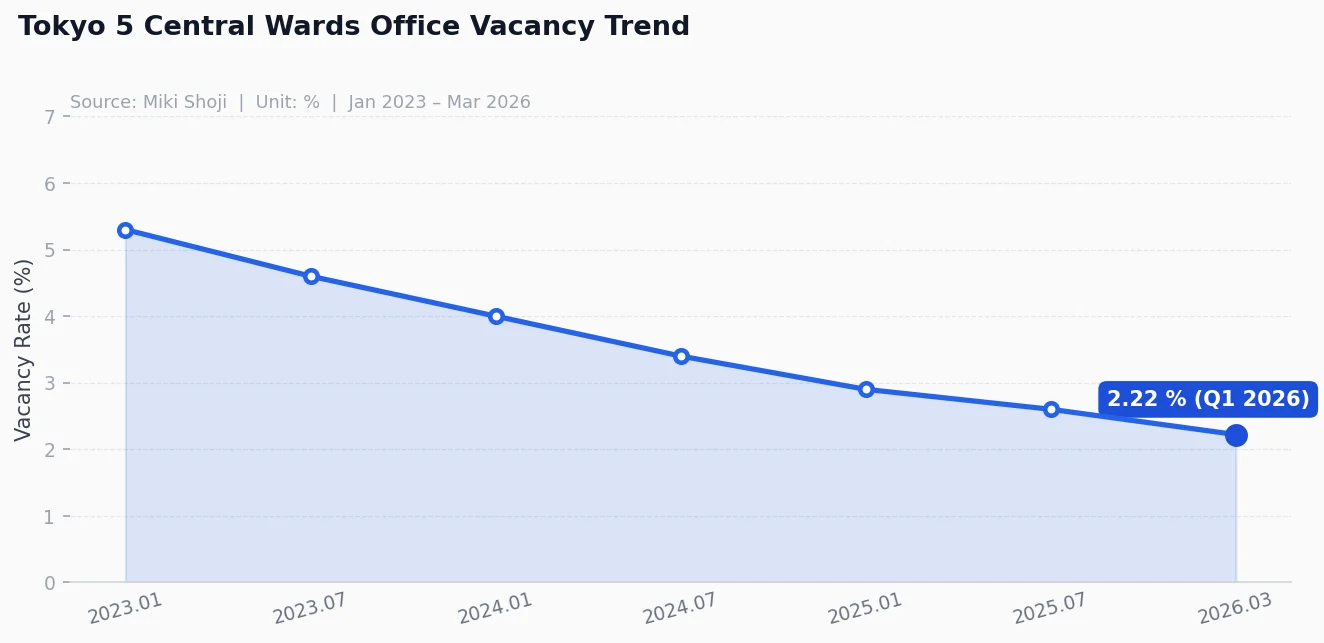
In March 2026, the average office vacancy rate across Tokyo’s five central wards—Chiyoda, Chuo, Minato, Shinjuku, and Shibuya—was 2.22%. That figure does not mean demand is equally strong in every building. This guide stays within what Miki Shoji’s monthly vacancy and asking-rent table supports, then sets out the checks needed for ward and building comparisons.
1. What does Tokyo’s 2.22% office vacancy rate mean?
The average vacancy rate was 2.22% in March 20261. It is a monthly observation in Miki Shoji’s table, not a Q1 average.
I read the figure as a lagging signal rather than a verdict on the whole market. The source reports vacancy and average asking rent; it does not establish effective rent, rent-free periods, or landlord bargaining power. Building-grade demand should not be inferred from 2.22% alone.
2. How do Tokyo’s five central wards differ?
The central 5 wards are not a monolithic market. Each ward is driven by unique demand profiles and supply pipelines.
1. Chiyoda: Read vacancy with asking rent The presence of ministries and corporate headquarters does not by itself prove the cause of demand. Start by checking whether Chiyoda’s vacancy and asking rent move together in the monthly table.
2. Shibuya: Verify the cause of low vacancy separately Shibuya’s monthly vacancy can be compared in the table. The source does not show that a specific redevelopment or IT-company demand caused the figure.
3. Minato: Treat supply and secondary vacancy as hypotheses Minato’s vacancy trend is visible, but claims about completed lease-ups or secondary vacancy in Grade B buildings require building-level leasing data.
4. Chuo and Shinjuku: Separate sector demand from the table Monthly vacancy and asking rent can be compared for both wards. Tenant demand by industry and future reconstruction schedules sit outside this source and need separate evidence.
3. What should investors check in Tokyo offices in 2026?
What are the common traps when looking at Tokyo office data today?
- Differences by building grade: “Flight to quality” is a hypothesis to test. Average vacancy does not establish longer vacancy periods in older, smaller buildings; use building-level data.
- Supply schedules: The previously linked generic MLIT statistics page did not support a supply gap in the second half of 2026. Do not infer stronger landlord bargaining power until a specific supply schedule is checked.
- Work patterns and space use: Separate tenant and occupied-area evidence is needed to connect hybrid work with floor area or rent.
4. How should vacancy and rent data be read?
I recommend the following routine for monitoring the Tokyo office market:
- Check Miki Shoji Tokyo monthly data1 (archive · portal): benchmark for vacancy and rent across the 5 wards.
- Do not use the previously linked REINS Market Watch as office-leasing evidence; it covers metropolitan-area used-home sales.
- Check effective rent and the supply pipeline separately with lease-term data and project-specific development schedules.
In short, 2.22% is the March 2026 average for Tokyo’s five central wards. Use it as a starting point, then verify building-level vacancy, asking rent, and lease terms separately.
Data date: The 2.22% Tokyo five-ward vacancy rate is Miki Shoji’s monthly figure for March 2026. Check the reference month and metric definition in the source before acting.
Investor Action: Session Summary & Check
- Supply/Demand: Compare vacancy and average asking rent for the same reference month in Miki Shoji.
- Building differences: Test secondary-vacancy risk with building-level vacancy and tenant-movement data.
- Lease terms: Distinguish asking rent from effective rent and check concessions separately.
Recommended Series
- Tokyo Mansion Price Comparison: Chiyoda, Chuo, Minato
- Small Rental Yield vs Capital Gain Breakeven Analysis
- Japan Rate Hike Cycle: 3 Lessons for J-REIT Investing


![Tokyo's 23 Wards Compared — Property Prices & Living Environments [2026]](https://gsfark.com/assets/images/blog/tokyo-ward-guide-series-prologue-hero-og.jpg)
![Tokyo's 6 Key Wards: Real Estate Data & Investment Insights [2026]](https://gsfark.com/assets/images/blog/tokyo-6-wards-real-estate-insight-hero-og.jpg)