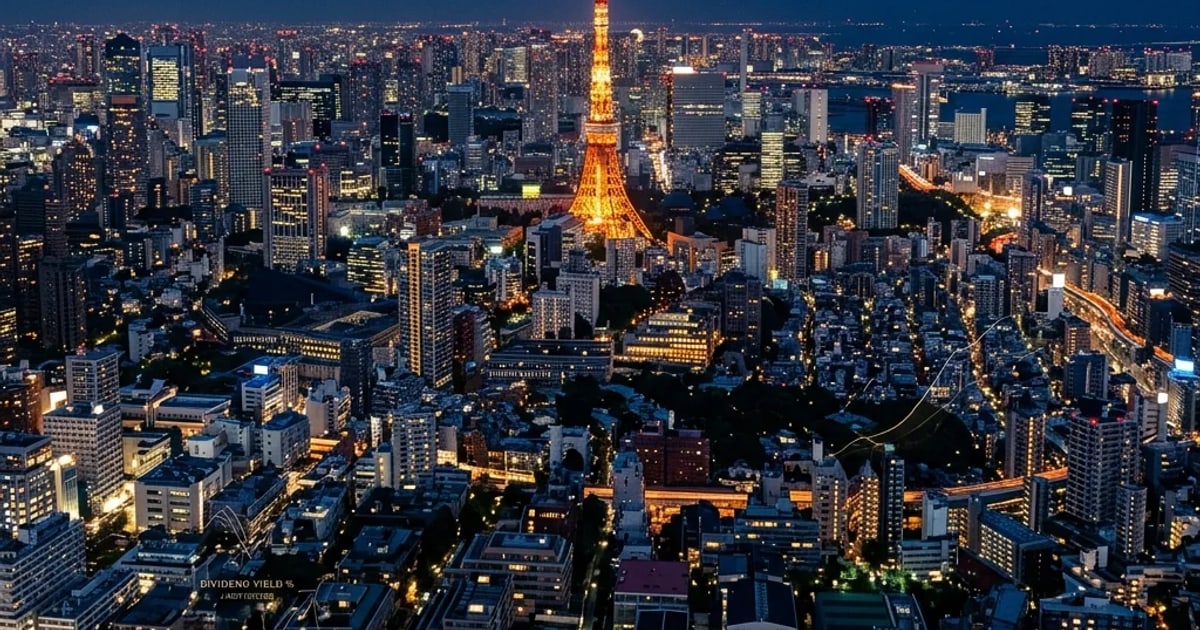
![Shinjuku, Shibuya & Bunkyo Home Prices and Living Profiles [Ep.2·2026]](https://gsfark.com/assets/images/blog/tokyo-shinjuku-shibuya-bunkyo-hero-og.jpg)
※ This article is for informational purposes and personal analysis only—not investment, legal, tax, or immigration advice, and not a recommendation to buy or sell any property or financial product. Verify figures, rules, and market data against official sources and consult qualified professionals; you are solely responsible for your decisions. Information reflects the time of writing and may change afterward.
Average condo prices run ¥1.359M per ㎡ in Shinjuku, ¥1.800M in Shibuya, and ¥1.315M in Bunkyo. If Roppongi and Azabu are “expat Tokyo,” Shinjuku and Shibuya are “Tokyo for Tokyoites.” That’s how I framed it the first time I compared the two. Same price tier. Completely different lives. Which one is right for you isn’t a data question — it’s a lifestyle question.
This chapter follows the Series Prologue and Ep.1 (Chiyoda, Chuo, Minato) with a deep dive into the remaining three of Tokyo’s Core 6 Wards (都心6区) — Shinjuku, Shibuya, and Bunkyo. They share a premium price bracket. But their character couldn’t be more different: a commercial mega-hub, the birthplace of trends, and a quiet city of scholarship.
What’s Covered
| Section | Topic |
|---|---|
| 1. Shinjuku (新宿区) | The world’s busiest terminal city — structure and investment logic |
| 2. Shibuya (渋谷区) | Trend capital and Tokyo’s highest appreciation ward |
| 3. Bunkyo (文京区) | A university city anchored by UTokyo and quiet family life |
| 4. Comparison Summary | Side-by-side data table |
| 5. Notes for Foreign Buyers | Legal, mortgage, and administrative basics |
1. Shinjuku (新宿区)
Brand Positioning
Step out of Shinjuku Station, and which exit you take leads to a completely different city. Shinjuku is Tokyo’s most complex, most layered ward. Centered on Shinjuku Station — the world’s busiest by daily foot traffic — two entirely different cities coexist side by side.
The west side (Nishi-Shinjuku) is a CBD of government offices and corporate towers. The east side (Higashi-Shinjuku, Kabukicho) is a dense commercial zone of food, entertainment, and nightlife. Shin-Okubo sits between them — Tokyo’s de facto Korean town, a dense cluster of Korean residents and businesses that is the most familiar neighborhood for Korean newcomers, with an atmosphere reminiscent of Seoul’s Yeonnam-dong.
For Korean relocators, Shinjuku isn’t just a neighborhood. It’s a psychological lifeline. I remember walking through Shin-Okubo on my first week after moving. Korean signs, Korean grocers, Korean restaurants wall to wall. Having one place where the language just works — you don’t understand what that means until you’ve lived without it.
Average Mansion Prices
| Sub-area | Price per ㎡ (2025–2026) | Per Tsubo (坪) |
|---|---|---|
| Nishi-Shinjuku / City Hall area | ¥1.3M–¥2.0M/㎡ | ¥4.3M–¥6.6M/坪 |
| Yotsuya / Ichigaya | ¥1.1M–¥1.6M/㎡ | ¥3.65M–¥5.3M/坪 |
| Shin-Okubo / Takadanobaba | ¥0.9M–¥1.3M/㎡ | ¥3.0M–¥4.3M/坪 |
| Waseda / Kagurazaka area | ¥0.85M–¥1.2M/㎡ | ¥2.8M–¥4.0M/坪 |
| Ward average | ¥1.359M/㎡ | ¥4.49M/坪 |
Source: Ministry of Land, Infrastructure, Transport and Tourism (MLIT) — Real Estate Transaction Price Information, 2025 Q1-Q4 (n=1,298)
Shinjuku is the only Core 6 Ward with sub-areas below ¥1M/㎡. For budget-conscious investors, it offers the lowest entry barrier in the premium tier.
Average Rent
| Type | Monthly Range |
|---|---|
| Studio (1R) | ¥90K–¥140K/mo |
| 1K / 1DK | ¥110K–¥180K/mo |
| 1LDK | ¥180K–¥350K/mo |
| 2LDK | ¥300K–¥600K/mo |
| 3LDK+ | ¥550K+/mo |
Units within walking distance of Shinjuku Station start from ¥130K even for studios. Shin-Okubo and Takadanobaba run ¥20K–¥30K cheaper for the same type.
Average Household Income
The average taxable income for Shinjuku residents is estimated at approx. 6.1 million JPY (610만 JPY)/year (editorial estimate based on MIC municipal taxable-income statistics)1 — the lowest among the Core 6 Wards. But the diversity of the tenant base (students, workers, foreign nationals) keeps vacancy risk exceptionally low.
Population
| Item | Figure |
|---|---|
| Total population | approx. 353,000 (Jan 2025)2 |
| Population density | approx. 19,400/㎢ |
| Trend | Foreign resident population rising |
Foreign Resident Ratio
Shinjuku’s foreign resident ratio stands at approx. 12.6% — the highest among Tokyo’s 23 wards (Jan 2024, Shinjuku City official data).3 Chinese and Korean nationals dominate, with a vibrant multinational community centered on Shin-Okubo.
Who Should Consider Shinjuku
- Relocators: Best ward for Korean nationals arriving in Tokyo for the first time. Shin-Okubo community, Korean networks, and multilingual infrastructure are unrivaled.
- Investors: Diverse tenant pool reduces vacancy risk. Small-unit (1LDK and under) gross yield ranges 4–5% — top tier within Core 6.
- Visitors: Shinjuku Gyoen, free Tokyo Metropolitan Government Observatory, Kabukicho nightlife, Golden Gai bar alley.
Key Landmarks
- Shinjuku Gyoen (新宿御苑) — Environment Ministry national park. Cherry blossoms, French formal garden, wide lawns open year-round.
- Tokyo Metropolitan Government Building (東京都庁) — Free observation deck on the 45th floor. On clear days, Mt. Fuji is visible.
- Golden Gai (ゴールデン街) — 200+ micro-bars in a retro alley. The original DNA of Tokyo’s underground nightlife.
- Shin-Okubo (新大久保) — Tokyo’s Korean street. K-food, K-pop goods, Korean supermarkets.
2. Shibuya (渋谷区)
Brand Positioning
Shibuya is Tokyo’s fastest-changing ward. Since the 2010s, Hikarie, Scramble Square, Fukuras, and Sakura Stage have redrawn its skyline in a wave of mega-redevelopment that shows no sign of stopping.
But Shibuya’s real identity predates the cranes. The belt running through Omotesando (表参道), Daikanyama (代官山), and the edges of Nakameguro (中目黒) hosts the densest concentration of creative industry in Japan. Fashion, advertising, IT startups, media — these workers don’t just work in Shibuya. They live here.
My view is clear. Among the Core 6 Wards, Shibuya has the highest upside potential over the next decade. Redevelopment momentum, high-income millennial inflow, foreign corporate HQ concentration — I see Shibuya as the strongest candidate where all three work simultaneously.
Average Mansion Prices
| Sub-area | Price per ㎡ (2025–2026) | Per Tsubo (坪) |
|---|---|---|
| Omotesando / Aoyama | ¥1.8M–¥2.8M/㎡ | ¥6.0M–¥9.25M/坪 |
| Daikanyama / Ebisu | ¥1.5M–¥2.3M/㎡ | ¥5.0M–¥7.6M/坪 |
| Nakameguro / Yutesuji | ¥1.3M–¥2.0M/㎡ | ¥4.3M–¥6.6M/坪 |
| Shibuya Station area | ¥1.2M–¥1.8M/㎡ | ¥4.0M–¥5.95M/坪 |
| Hatagaya / Hatsudai | ¥1.0M–¥1.4M/㎡ | ¥3.3M–¥4.65M/坪 |
| Ward average | ¥1.800M/㎡ | ¥5.95M/坪 |
Source: Ministry of Land, Infrastructure, Transport and Tourism (MLIT) — Real Estate Transaction Price Information, 2025 Q1-Q4 (n=907)
Omotesando and Aoyama are priced on par with Azabu in Minato Ward. Nakameguro has seen some of the steepest appreciation in Tokyo over the past five years.
Average Rent
| Type | Monthly Range |
|---|---|
| Studio (1R) | ¥110K–¥170K/mo |
| 1K / 1DK | ¥140K–¥220K/mo |
| 1LDK | ¥220K–¥450K/mo |
| 2LDK | ¥400K–¥800K/mo |
| 3LDK+ | ¥750K+/mo |
1LDK units in Daikanyama and Nakameguro typically run ¥250K–¥350K/month. Corporate housing demand from foreign firms keeps vacancy low at the high end.
Average Household Income
Shibuya’s average taxable income per resident is estimated at approx. 10.7 million JPY (1,070만 JPY)/year — among the very top of Tokyo’s 23 wards (editorial estimate based on MIC municipal taxable-income statistics).1 Creative industry executives and tech startup leadership drive the number.
Population
| Item | Figure |
|---|---|
| Total population | approx. 231,000 (Jan 2025) |
| Population density | approx. 14,000/㎢ |
| Trend | High-income 30s–40s increasing; 20s declining |
Foreign Resident Ratio
Shibuya’s foreign resident ratio is approx. 5.5–6% (2025, Shibuya City official data). The ward hosts a high concentration of international corporate offices, driving demand from expatriate professionals.
Who Should Consider Shibuya
- Relocators: The top choice for creative and tech professionals. Walkability to work and lifestyle quality coexist — rare in any city.
- Investors: Highest long-term appreciation potential in the Core 6. Gross yield 3.5–5% on small-to-mid units.
- Visitors: Omotesando walk, Daikanyama Tsutaya Books, Yoyogi Park, Scramble Crossing at night.
Key Landmarks
- Scramble Crossing (スクランブル交差点) — Up to 3,000 pedestrians at a time. Shibuya’s defining image.
- Daikanyama Tsutaya Books (代官山 蔦屋書店) — A world-famous lifestyle bookstore in Daikanyama, Shibuya Ward. The cultural anchor of Shibuya’s creative identity.
- Omotesando (表参道) — Tokyo’s answer to the Champs-Élysées. Luxury flagship stores lining a tree-canopied boulevard.
- Yoyogi Park (代々木公園) — Shibuya’s largest green space. Picnics, flea markets, and cultural events every weekend.
3. Bunkyo (文京区)
Brand Positioning
Bunkyo is the quietest ward in the Core 6 — and intentionally so. The University of Tokyo (東京大学), Tokyo Medical and Dental University (東京医科歯科大学), and Japan Women’s University (日本女子大学) define the ward’s identity before you even step inside it.
There’s no commercial noise here like Shinjuku or Shibuya. Koishikawa Korakuen’s formal garden, the shitamachi (old downtown) atmosphere of Yanaka, the quiet lanes around Hongo Campus — they all coexist in a ward that doesn’t feel like Tokyo at all.
I’ve compared Nihonbashi and Bunkyo side by side. Nihonbashi is a place you work. Bunkyo is a place you live. That distinction matters more than any price table I could show you.
Average Mansion Prices
| Sub-area | Price per ㎡ (2025–2026) | Per Tsubo (坪) |
|---|---|---|
| Koraku / Suidobashi | ¥1.1M–¥1.6M/㎡ | ¥3.65M–¥5.3M/坪 |
| Hongo / Yushima | ¥1.0M–¥1.45M/㎡ | ¥3.3M–¥4.8M/坪 |
| Koishikawa / Otsuka | ¥0.9M–¥1.3M/㎡ | ¥3.0M–¥4.3M/坪 |
| Hakusan / Nezu | ¥0.85M–¥1.2M/㎡ | ¥2.8M–¥4.0M/坪 |
| Ward average | ¥1.315M/㎡ | ¥4.34M/坪 |
Source: Ministry of Land, Infrastructure, Transport and Tourism (MLIT) — Real Estate Transaction Price Information, 2025 Q1-Q4 (n=808)
Bunkyo is the most affordable of the Core 6 Wards on a per-㎡ basis. Transit access (multiple JR and Metro lines) and living environment make it the best value-for-money play in the premium tier.
Average Rent
| Type | Monthly Range |
|---|---|
| Studio (1R) | ¥80K–¥130K/mo |
| 1K / 1DK | ¥100K–¥160K/mo |
| 1LDK | ¥160K–¥280K/mo |
| 2LDK | ¥250K–¥450K/mo |
| 3LDK+ | ¥400K+/mo |
Stable demand from students, researchers, and faculty keeps the rental market consistent. Small-unit gross yield is the highest in the Core 6.
Average Household Income
Bunkyo’s average taxable income per resident is estimated at approx. 7 million JPY (¥7.0M)/year (editorial estimate based on MIC municipal taxable-income statistics).1 University faculty, medical professionals, and researchers represent a large share — producing a stable, well-distributed income profile.
Population
| Item | Figure |
|---|---|
| Total population | approx. 235,000 (Jan 2025) |
| Population density | approx. 19,300/㎢ |
| Trend | Family relocations increasing; steady population growth |
Foreign Resident Ratio
Bunkyo’s foreign resident ratio is approx. 6–7%. UTokyo’s international student and researcher community forms the backbone. Chinese students represent the largest foreign national group.
Who Should Consider Bunkyo
- Relocators: The best ward for families prioritizing education. Top school districts, university hospital access, and safe residential environment — all three boxes checked.
- Investors: Lowest entry price in the Core 6, highest yield. Stable tenant pool (students and professionals) makes this a strong long-hold play.
- Visitors: UTokyo Hongo Campus walk, Koishikawa Korakuen garden, Nezu Shrine azalea tunnel, Yushima Seido Confucian temple.
Key Landmarks
- UTokyo Hongo Campus (東京大学本郷キャンパス) — Yasuda Auditorium and the Red Gate (Akamon). Open to the public.
- Koishikawa Korakuen (小石川後楽園) — An Edo-period daimyo garden next to Tokyo Dome. One of Tokyo’s finest historic gardens.
- Nezu Shrine (根津神社) — An Edo-era shrine in Nezu, Bunkyo Ward. Famous for its spring azalea tunnel festival (Bunkyo Tsutsuji Matsuri).
- Yushima Seido (湯島聖堂) — A Confucian temple established in 1690. Crowded with exam-season visitors seeking academic blessings.
4. Side-by-Side Summary
“Expensive means best” is a lazy conclusion. My view is different. For yield-focused investors, Bunkyo wins. For long-term asset appreciation, Shibuya wins. For tenant diversity and community, Shinjuku wins. The best ward depends entirely on what you’re optimizing for.
| Item | Shinjuku (新宿) | Shibuya (渋谷) | Bunkyo (文京) |
|---|---|---|---|
| Area | 18.23㎢ | 15.11㎢ | 11.29㎢ |
| Population (Jan 2025) | ~353,000 | ~231,000 | ~235,000 |
| Foreign resident ratio | ~12.6% | ~5.5–6% | ~6–7% |
| Avg. mansion price/㎡ | ¥1.359M | ¥1.800M | ¥1.315M |
| Avg. taxable income (est. from public statistics) | ~6.1 million JPY (~¥6.1M) | ~10.7 million JPY (~¥10.7M) | ~7 million JPY (~¥7.0M) |
| Gross yield (reference) | 4–5% | 3.5–5% | 4.5–5.5% |
| Core image | Multicultural · Community · Terminal | Trend · Creative · Redevelopment | Academic · Quiet · Family |
| Foreign-resident livability | ★★★★★ | ★★★★ | ★★★☆ |
Source: Ministry of Land, Infrastructure, Transport and Tourism (MLIT) — Real Estate Transaction Price Information, 2025 Q1-Q4 — Shinjuku n=1,298 / Shibuya n=907 / Bunkyo n=808
Comparing the three wards, what I kept confirming was one thing: can they be ranked on the same scale? The answer was no. Same price tier — but different standards make for a completely different choice.
5. Notes for Foreign Buyers
Legal Restrictions
Japan imposes no legal restrictions on foreign nationals purchasing real estate. Standard condominium (区分所有) acquisitions in the Core 6 Wards are open regardless of nationality.
Mortgages
- Non-residents: Japanese bank mortgages are effectively unavailable. Cash purchase or collateralization of home-country assets is the standard path.
- Residents (valid visa holders): Some major banks offer mortgages to foreign nationals, but terms vary by bank and branch — confirm directly with each lender. Typically required documents: Residence card, two years of withholding tax statements, employment contract.
Management Fees & Repair Reserve Fund
Tower mansions in the Core 6 can carry monthly management fees (管理費 — Kanrihi) and repair reserve contributions (修繕積立金 — Shūzen Tsumitatekin) totaling ¥30K–¥100K/month. Always confirm these in addition to the purchase price.
Language & Administration
- Shinjuku City Hall operates multilingual service windows (English, Chinese, Korean). Korean-speaking staff are available.
- Shibuya and Bunkyo City Halls offer English support, though some procedures remain Japanese-only.
- For property transactions, I recommend using a bilingual interpreter or a real estate agency specializing in foreign national clients.
View All in This Series
- Series Prologue: Where to Live in Tokyo
- Ep.1: Core 3 Wards — Chiyoda, Chuo, Minato
- Ep.3: Western Premium Residential Belt — Meguro & Setagaya
- Ep.4: Business Gateway — Shinagawa & Ota
- Ep.5: Hipster Inner Ring — Toshima, Nakano, Suginami

![Tokyo Core 3 Ward Home Prices — Chiyoda, Chuo & Minato [Ep.1·2026]](https://gsfark.com/assets/images/blog/tokyo-core-3-wards-chiyoda-chuo-minato-hero-og.jpg)
![Where Are Setagaya's Affluent Areas? — Seijo & Meguro Property Prices [Ep.3·2026]](https://gsfark.com/assets/images/blog/tokyo-meguro-setagaya-hero-og.jpg)