※ This article is for informational purposes and personal analysis only—not investment, legal, tax, or immigration advice, and not a recommendation to buy or sell any property or financial product. Verify figures, rules, and market data against official sources and consult qualified professionals; you are solely responsible for your decisions. Information reflects the time of writing and may change afterward.
Seoul and Tokyo, the two mega-hubs of East Asia, are often described through the lens of a ‘Parallel Theory.’ The narrative of ‘Japanification’—that South Korea is following Japan’s path of demographic aging and low growth—has been the source of profound anxiety in the Korean investment market for the past decade.
However, as of 2026, the two markets are not mere carbon copies but are in a state of ‘Complementary Decoupling.’ Seoul maintains strong momentum driven by regulation-induced supply shortages and a high concentration of demand in prime districts. Meanwhile, Tokyo has reinvented itself as a ‘Safe-Haven Hub’ for global capital at the tail end of its ultra-low-rate era. Now is the time to read these two markets not as isolated islands, but as a single, integrated portfolio.
1. The Numbers of 2026: Seoul’s Momentum vs. Tokyo’s Acceleration
These two markets are currently powered by different engines.
- Seoul (Forecasted Growth 6~7.9%, Savills Research): Rising Jeonse (rental) prices and a “supply cliff” for new apartments provide a strong floor for prices. Despite sustained high interest rates, the “flight to quality” toward core districts is accelerating, leading to a qualitative inflation of asset values.
- Tokyo (Forecasted Growth 4~5.9%, Savills Research): The market is taking a breather after the rapid surge of 2025 (Tokyo Kantei recorded approx. +34.6% YoY for 23 wards). However, the Yen’s weakness and relatively low interest rates compared to other global cities keep it attractive as the “most affordable global megacity” for international investors.1
2. Strategic Synergy Beyond the ‘Japanification’ Fear
Paradoxically, the fear of Korea’s Japanification has driven Korean investors toward Japan. ‘Investment Nomads’ seeking to avoid domestic regulatory risks and diversify their currency exposure are flocking to Tokyo.
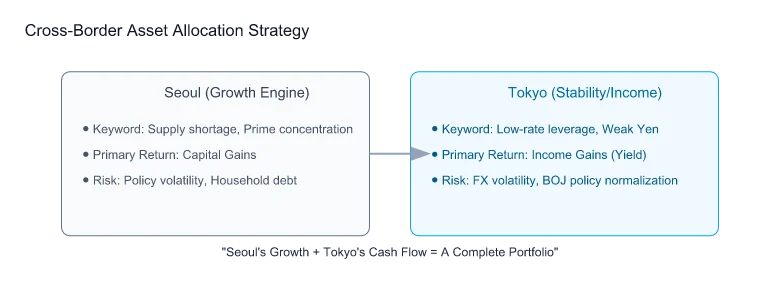
- Risk Diversification: While Seoul real estate is highly sensitive to domestic policy and household debt risks, Tokyo real estate is more responsive to global interest rates and FX trends. Holding assets in both cities provides a natural hedge against localized policy shocks.
- Complementary Yield Structures: Seoul is primarily a capital gains market, whereas Tokyo is an income gains (rental yield) market. Investors can use the steady cash flow from Tokyo properties to offset the lower yields but higher growth potential of their Seoul holdings.
3. The Seoul-Tokyo Asset Allocation Matrix
How should an investor balance their holdings between these two hubs?
4. Execution Framework: Integrated Monitoring
Investors should now place both markets on a single dashboard:
- Monitor Rate Spreads: Watch the gap between the Bank of Korea (BOK) and the Bank of Japan (BOJ) to anticipate Yen trends and borrowing costs.23
- Cross-Check Supply Cycles: Overlay Seoul’s move-in volume with Tokyo’s office/mansion delivery schedule to optimize entry timing.
- Currency Rebalancing: If 70% of your assets are in KRW, filling the remaining 30% with JPY-denominated assets provides a defensive buffer against currency devaluation.
5. Conclusion: The Era of the Borderless Investor
There was a time when Seoul real estate was the only game in town. But the investor of 2026 is not trapped by borders. You need the flexibility to grow capital in a Seoul apartment, collect monthly rent from a Tokyo office, buy when the Yen is cheap, and realize profits when it strengthens.
GSF serves as the bridge between Seoul and Tokyo, ensuring your assets achieve maximum efficiency across the East Asian corridor. When you read these two markets as one, your investment opportunities don’t just double—they multiply.
Data freshness (April 2026): BOJ policy rate 0.75 %, 10-year JGB ≈ 2.43 %, TSE REIT Index ≈ 1,916, Tokyo 5-ward vacancy 2.22 % (Miki Shoji Q1 2026), Q1 2026 inbound tourists 10.68 M (JNTO). Verify the latest from linked sources before acting.
Investor Action: Session Summary & Check
- Allocation: Hedge currency risk naturally by setting your KRW:JPY asset ratio to roughly 7:3.
- Metrics: Monitor and compare Seoul’s Jeonse-to-price ratio and Tokyo’s effective yield (Cap Rate) on a monthly dashboard.
- Taxes: Confirm with an expert if the foreign tax credit under the KR-JP Tax Treaty applies to your specific portfolio.
Recommended Series
- 3 Principles for FX Volatility: Managing Yen Risk
- Korea-Japan Inheritance Tax: The 10-Year Rule Trap
- Tokyo Office Market 2026: Vacancy and Supply Forecast


![How to Invest in Tokyo Real Estate — Steps, Costs and Taxes [2026]](https://gsfark.com/assets/images/blog/tokyo-real-estate-investment-complete-guide-hero-og.jpg)
![Are Hachioji Home Prices Really Cheap? Hino & Akishima Compared [Ep.11·2026]](https://gsfark.com/assets/images/blog/tokyo-hachioji-hino-akishima-hero-og.jpg)